Cold Email Benchmarks 2026: Every Number That Matters
Cold email benchmarks for 2026 in one place: reply rate, open rate, bounce rate, sequence length, meeting rates, and cost per meeting, tiered and sourced.
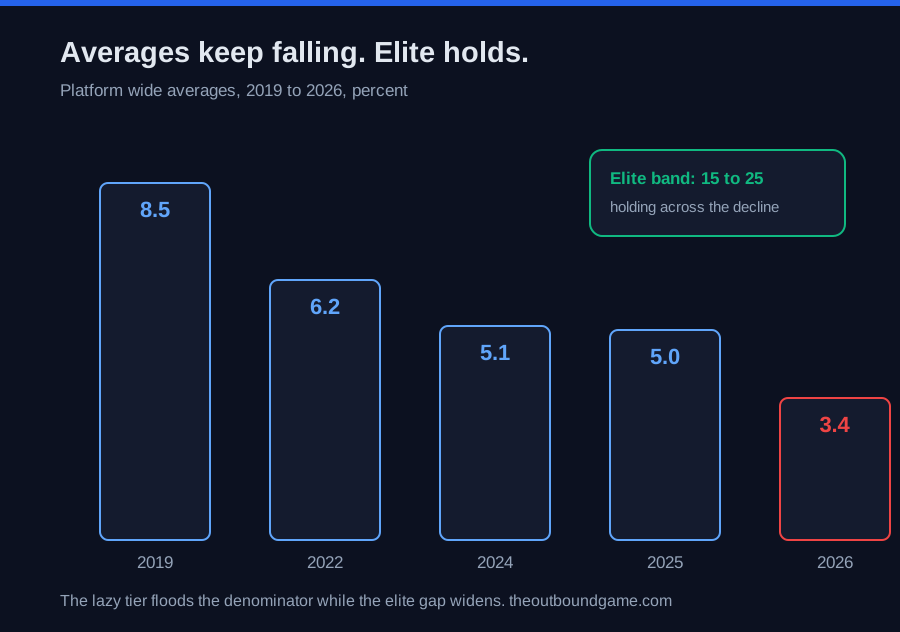
Every conversation about cold email benchmarks eventually hits the same wall: the numbers disagree. One study of billions of interactions puts the average reply rate at 3.43 percent, another analysis of two million emails says 2.09, a third lands at 3.1, and a sales influencer screenshots 40 percent open rates like it is Tuesday. None of them are lying. They measure different senders, different methodologies, and different definitions, which is why this page reports honest ranges with tiers instead of single cherry picked numbers, and why every figure here comes from the major 2026 datasets: platform reports covering billions of sends, and independent studies of 53 million, 20 million, 10 million, and 2 million emails respectively.
Treat these cold email benchmarks as a diagnostic panel, not a report card. A reply rate that would be a red flag in legal services, where top campaigns reach 10 percent, is close to normal in SaaS, where averages run under 2. The tiers that matter are relative: average is where the market’s laziness lives, good means your system works, elite means targeting, relevance, and infrastructure are all firing. And one framing rule before the numbers: when a metric is below benchmark, the cause is almost always list quality, infrastructure, copy, or follow up, in that order.
This is the stat hub of our metrics layer, built to be linked from everywhere: the craft numbers feed how to write a cold email, the funnel logic feeds the b2b outbound sales pillar, and the argument these cold email statistics settle is made in full in why outbound sales still works.
The funnel, end to end, with real numbers
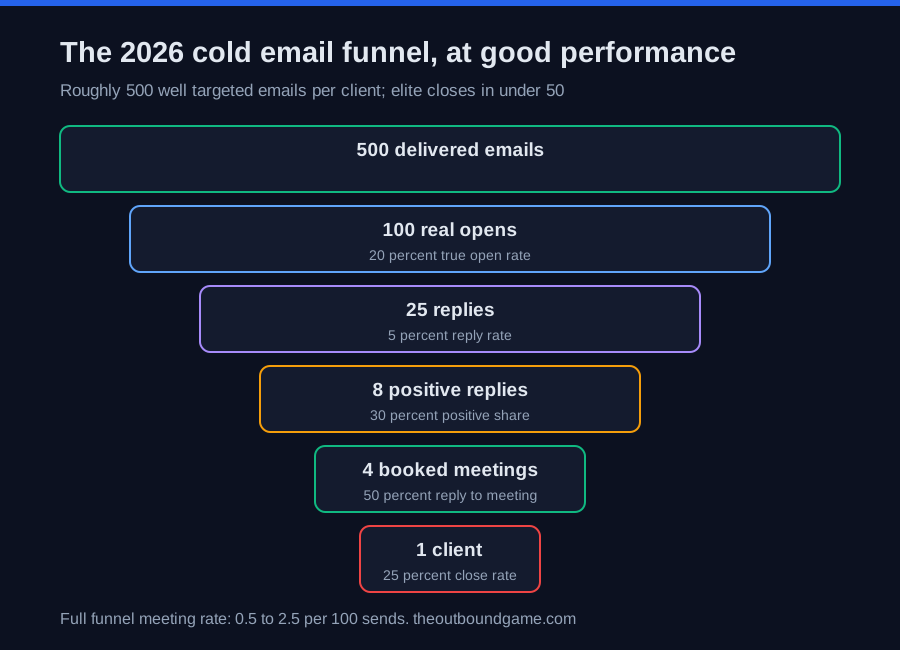
Here is what a campaign at roughly average to good performance looks like as a funnel: 500 delivered emails produce about 100 real opens, 25 replies, 8 positive replies, 4 booked meetings, and 1 client. That path assumes a 20 percent true open rate, a 5 percent reply rate, a 30 percent positive share of replies, a 50 percent reply to meeting conversion, and a 25 percent close rate, and it explains the working rule that a client costs roughly 500 well targeted emails, while elite campaigns close clients in under 50.
Two funnel wide numbers deserve their own line. Full funnel meeting conversion, meaning booked meetings per email sent, runs 0.3 to 0.7 percent for typical campaigns, with the strongest programs booking 2 to 3 meetings per 100 sends. And the economics that justify the whole channel: cold email delivers a meeting for roughly 153 dollars of total cost against roughly 2,778 for cold calling in the same 2026 analysis, an 18x gap that is the quiet reason email remains the backbone of scaled outbound.
Reply rate: the metric that actually matters
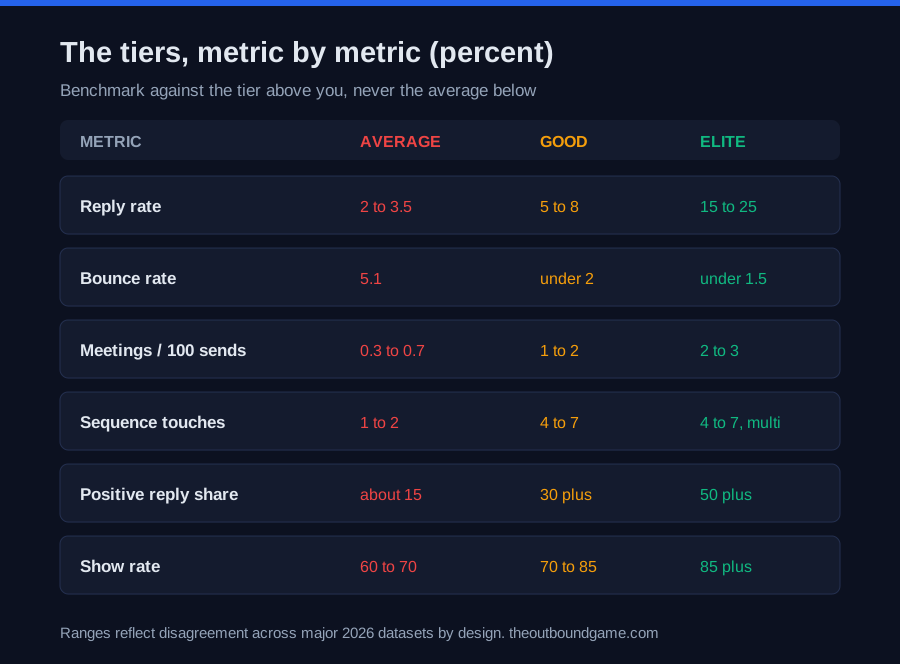
The honest 2026 range for average reply rate is 2 to 3.5 percent depending on dataset, with 3.43 the most quoted figure. The tiers: above 5 percent is good and already beats most of the market, 8 to 12 percent is excellent, and 15 to 25 percent is the elite band that signal driven, deeply personalized campaigns reach. Below 3 percent, the problem is usually deliverability or targeting rather than copy, and below 1 percent something fundamental is broken.
Reply rate moves with knowable levers. Small targeted campaigns under 50 recipients average 5.8 percent against 2.1 for 500 plus blasts. Advanced personalization doubles responses at 18 versus 9 percent, and trigger event outreach triples standard token personalization, the machinery behind those numbers being the assembly line in how to personalize cold emails at scale. One nuance the headline hides: only a portion of replies are positive, with datasets ranging from about 14 percent of replies in high volume operations to 50 percent plus in tightly targeted ones, so track positive reply rate separately, because it is the true message market fit signal.
Open rate, bounce rate, and the numbers that lie
Open rate is the most quoted and least trustworthy cold email statistic in 2026. Apple Mail accounts for roughly half of all opens and preloads tracking pixels automatically, so reported averages of 42 to 44 percent coexist with a true engaged open rate closer to 21 to 28 percent. Per Snov.io’s 10 million email analysis, personalized subject lines earn about 21 percent opens against 15 for generic ones, but use opens only as a deliverability smoke alarm, if reported opens fall below about 30 percent you likely have an inbox placement problem, and never as a success metric. Subject lines still matter for the real opens: 6 to 10 words, specific over clever, with question formats lifting opens by about 21 percent, per the formulas in cold email subject lines.
Bounce rate is the opposite: unglamorous and decisive. The all sender average sits near 5.1 percent, the healthy target is under 2, and top performers hold under 1.5. Verified lists bounce around 1.5 percent, unverified around 2.5, and purchased lists near 18.5, which is why verification is the single biggest performance differentiator between top and bottom senders, and why bounce problems cascade into the spam placement causes ranked in why cold emails go to spam. The list disciplines behind these numbers live in how to build a b2b prospect list.
Sequences, follow ups, and timing
Sequence length has a well mapped sweet spot: 4 to 7 touches total. Campaigns with 3 to 5 follow up steps hit roughly 8.3 percent reply rates against 4.1 without follow ups, a single follow up lifts replies by about 66 percent, and the datasets split on attribution, with the largest platform report crediting the first email with 58 percent of replies and follow ups with 42, while other 2026 analyses put the follow up share at 44 to 70 percent. Either way the operating rule is identical: a sequence without follow ups leaves close to half its results unclaimed, and the first follow up, sent as something that reads like a reply rather than a reminder, is the single most valuable email after the opener. Beyond four follow ups, spam complaint risk rises sharply, which is where the sales cadence discipline earns its keep.
Timing is a smaller lever than most teams believe, worth around 14 percent of variance: Tuesday through Thursday sends in the recipient’s local time zone, morning or mid afternoon, perform best, with follow ups spaced 3 to 7 days apart. Copy remains governed by the word budget: the 50 to 125 word band beats 200 plus word emails by more than double, first touches under 80 words, one call to action, per the full anatomy in how to write a cold email.
Meetings, shows, and the numbers your CFO reads
The pipeline metrics close the loop. Reply to meeting conversion runs 30 to 45 percent for high intent campaigns that confirm interest quickly, while positive reply to booked meeting averages 10 to 15 percent with good teams above 20. Meeting show rates for cold sourced meetings sit at 70 to 85 percent, and a show rate under 60 usually means meetings were booked without conviction. Full funnel, expect 0.5 to 2.5 booked meetings per 100 emails depending on deal type and offer clarity, and hold campaigns accountable to cost per meeting and pipeline created rather than any activity number, because sends and opens create the illusion of progress while replies and held meetings create revenue.
For volume planning, the reverse math from the funnel is the honest sizing tool: clients wanted, divided by close rate, meeting rate, positive share, and reply rate, times a 1.2 safety factor. Five clients at industry average metrics prices out near 3,200 delivered emails, which is why the infrastructure limits, roughly 100 sends per mature inbox per day and 20 to 30 on new domains, translate directly into how many mailboxes and weeks a revenue target requires.
Five ways teams misread cold email benchmarks
-
Grading on open rate. Half of opens are Apple’s robot, not your prospect. Opens diagnose placement; replies measure performance.
-
Comparing across methodologies. A 2.09 percent average from one counting rule and a 3.43 from another are both true. Benchmark against one dataset’s tiers, not a blend of headlines.
-
Ignoring industry spread. Legal services tops 10 percent replies while software runs under 2. Vertical context turns the same number from failure into excellence.
-
Treating average as acceptable. The average includes every burned domain and purchased list on the internet. The good tier is the real floor for a functioning system.
-
Skipping the positive reply split. A 6 percent reply rate that is mostly unsubscribes loses to a 4 percent rate that is mostly interest. Classify replies or the benchmark flatters the wrong campaign.
An eight step benchmark audit you can run this week
-
Pull 90 days of campaign data and compute reply, positive reply, bounce, and meetings per 100 sends, using unique contacts as the denominator.
-
Place each metric in its tier. Average, good, or elite, per the tables above, against your own vertical’s spread.
-
Check bounce first. Above 2 percent, stop sending, verify the list, and fix data quality before touching anything else.
-
Check placement second. Reported opens under 30 percent or a reply collapse means the diagnosis moves to the deliverability layer, not the copy.
-
Audit the sequence shape. Fewer than four touches or more than seven, and the follow up share of replies tells you which direction to correct.
-
Split replies by sentiment. Positive share under 30 percent points at targeting and offer, not volume.
-
Compute cost per meeting. Software plus data plus labor over meetings held, benchmarked against the roughly 153 dollar email standard, with the platform economics from instantly.ai and its rivals as the cost baseline and reviews from operators of the cold email software category as the sanity check.
-
Fix one lever per sprint. List, infrastructure, copy, follow up, in that order, remeasuring after 2 to 4 weeks of stable sending, because benchmarks reward the sequence of fixes, not the size of them.
How the benchmarks fit the broader outbound stack
-
Cold email benchmarks grade the whole b2b outbound sales system, and every layer below moves one of them.
-
Reply rate ceilings are set at the how to build a b2b prospect list layer, where fit and verification live.
-
The 18 versus 9 percent personalization gap is manufactured in how to personalize cold emails at scale.
-
The word count and CTA numbers are applied line by line in how to write a cold email.
-
The open rate you can trust is earned at the cold email subject lines layer.
-
Bounce and placement thresholds are enforced by the causes in why cold emails go to spam.
-
The follow up share of replies is claimed through the sales cadence playbook.
-
And proven skeletons for every touch live in the cold email templates library, where structure is stolen and sentences are not.
FAQ
Frequently asked questions
What is a good cold email reply rate in 2026?
What is a good cold email open rate?
What bounce rate is acceptable for cold email?
How many follow ups should a cold email sequence have?
How many meetings should cold email book?
How many cold emails does it take to get a client?
Why do cold email statistics differ so much between reports?
The bottom line
The cold email benchmarks that matter in 2026 fit on one panel: replies at 5 percent good and 15 plus elite against a 2 to 3.5 average, bounces under 2, sequences of 4 to 7 touches claiming the roughly half of replies that live in follow ups, 0.5 to 2.5 meetings per 100 sends, show rates above 70, and a meeting for about 153 dollars all in. Read them as a diagnostic: bounce points at data, placement points at infrastructure, reply points at targeting and relevance, and meeting conversion points at offer and process. The averages will keep declining as the lazy tier floods the denominator, the elite tiers will keep holding, and the whole game is deciding which population your numbers belong to.
Want more tested breakdowns like this? We publish one honest teardown of outbound tools, tactics, and playbooks each week. Join the newsletter.
More on Metrics & Ops
Cold Email Open Rates: What Is Good and What Is Real
Cold email open rates in 2026: the honest benchmarks, how Apple MPP inflates the number, the three uses that survive, and what to track instead.
How to Measure Outbound Sales: KPIs That Matter in 2026
How to measure outbound sales in 2026: the three layer KPI stack, pipeline coverage and velocity formulas, benchmarks, and the review cadence that works.
Cold Email Reply Rate: What Is Good and How to Raise It
Cold email reply rate in 2026: what counts as good, how to measure it honestly, and the seven levers that raise it, ranked by real effect size.