How to Measure Outbound Sales: KPIs That Matter in 2026
How to measure outbound sales in 2026: the three layer KPI stack, pipeline coverage and velocity formulas, benchmarks, and the review cadence that works.
Knowing how to measure outbound sales is a focus problem before it is a data problem. Teams tracking 5 to 7 core KPIs hit 91 percent average quota attainment against 73 for teams tracking almost nothing, while the dashboard with 28 color coded metrics produces the modern default: activity numbers glowing green on top of a red pipeline, in a market where 69 to 78 percent of reps missed quota last year. The fix is a three layer stack with a rule attached. Activity metrics at the base, conversion metrics in the middle, pipeline and revenue metrics on top, and the rule: manage the team through the leading indicators, evaluate the system on the lagging ones. Miss that distinction and you end up coaching people to game dials while the quarter quietly slips.
This is the measurement layer of our metrics coverage, and it sits deliberately above the channel numbers: the email specific tiers live in the cold email benchmarks hub, the single metric monograph in cold email reply rate, and the calling funnel in why cold calling still works. Here is how to measure outbound sales across the whole motion, from touches to meetings to pipeline to cost, with the formulas, the 2026 benchmarks, and the review cadence that turns numbers into decisions.
One definition keeps everything honest: a metric becomes a KPI only when it has an owner, a target, and a decision attached. Emails sent on Tuesday is a metric; sequence to meeting rate with a 5 percent target reviewed weekly by a named person is a KPI. Everything below earns its dashboard space by that test.
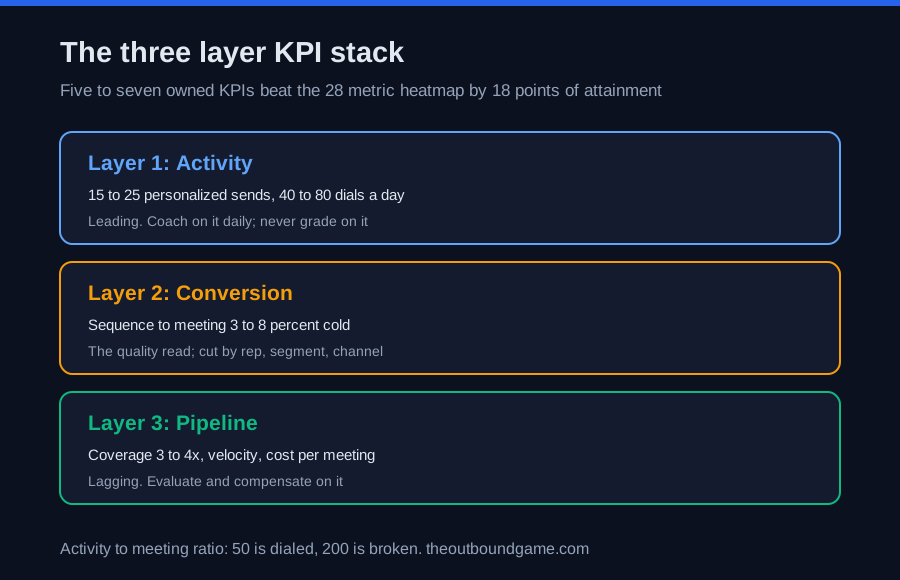
Layer one: activity metrics, the coaching layer
Activity metrics are leading indicators and coaching tools, never success measures, because they are the easiest numbers in sales to game. The 2026 working ranges: 15 to 25 highly personalized emails a day per rep, or 40 to 80 with automation assistance, capped by the sending limits; 40 to 80 dials in dedicated call blocks; 20 to 30 LinkedIn connection requests; and 50 to 150 new prospects sourced per week depending on deal complexity. These numbers exist to answer one question in a Monday coaching conversation: is the input present, and is it aimed at the right accounts.
The one activity derived number that graduates to strategy is the activity to meeting ratio, total touches divided by qualified meetings booked, because it is the efficiency score of the whole system. Around 50 touches per meeting means the machine is dialed; 200 means the ICP, message, or channel mix is broken. And the single biggest lever on it is coordination: teams running email, phone, and LinkedIn inside one sales cadence book meetings at roughly half the activity cost of single channel teams.
Layer two: conversion metrics, where the truth lives
The middle layer measures whether effort becomes outcomes, and its king is sequence to meeting rate: the share of prospects entering a sequence who eventually book, benchmarked at 3 to 8 percent for cold and 10 to 20 for signal triggered outreach, the single best read on sequence quality. Around it sit the funnel conversions: reply rates against the tiers, connect rates against the calling benchmarks, meeting show rate at 75 to 80 percent healthy, and meeting to opportunity conversion at 40 to 60 percent, the number that tells you whether discovery calls are qualifying or just occurring.
Cut every conversion metric three ways: by rep for coaching, by segment for targeting truth, and by channel for budget, because channel attribution routinely reveals that one channel books 60 percent plus of meetings, which is a resourcing instruction hiding in a spreadsheet. Small samples read directionally, so verdicts wait for two weeks of stable data, the same rule that governed the launch phase.
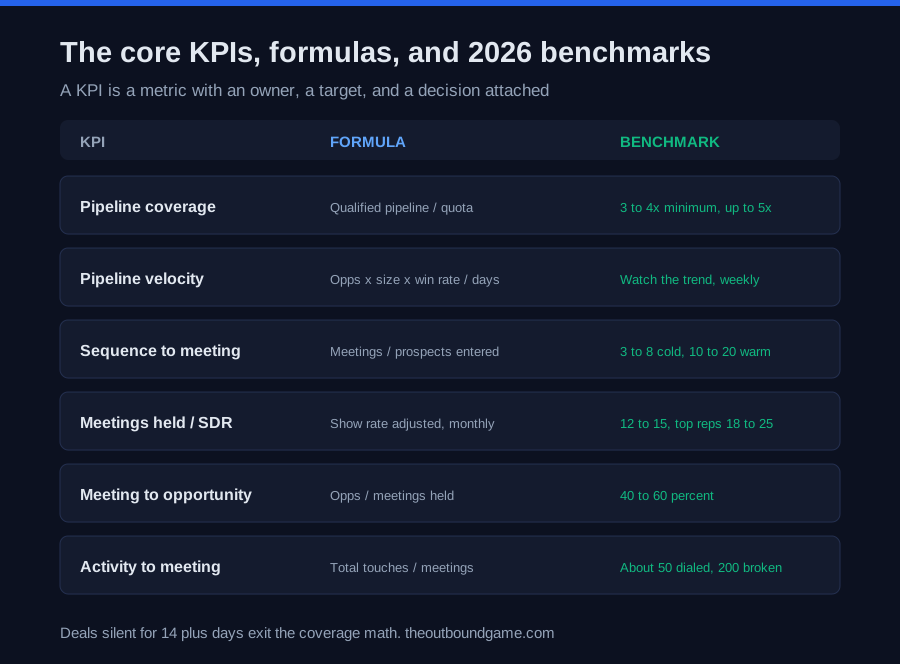
Layer three: pipeline and revenue, the accountability layer
Pipeline coverage is the single best leading indicator of quota in the entire stack: qualified pipeline value for the next one to two sales cycles divided by quota, with 3 to 4x the working minimum, 4 to 5x when win rates run under 25 percent, and anything below 2.5x a near guarantee of a miss. The trap is the word qualified, because coverage inflated by zombie deals, opportunities stalled past their close dates or silent for 14 plus days, is false confidence with a decimal point. Pair it with pipeline created per week by source, the ultimate outbound accountability number, and with the show rate adjusted meeting count, since a fully ramped SDR benchmarks at 12 to 15 qualified meetings held per month with top performers at 18 to 25.
Pipeline velocity compresses four numbers into one operational read: qualified opportunities times average deal size times win rate, divided by sales cycle length in days, yielding revenue per day. It matters because it moves when any lever moves, and per Salesforce’s State of Sales research the teams that manage to it catch deterioration a quarter earlier than teams staring at static pipeline value. Close the layer with the money metrics: cost per meeting and cost per opportunity by channel, benchmarked against the roughly 153 dollar email standard and 150 to 400 for calling, and quota attainment read as a distribution, because best in class teams put 60 to 70 percent of reps at or above 100 percent, and an average carried by two closers is a hiring problem wearing a trophy.
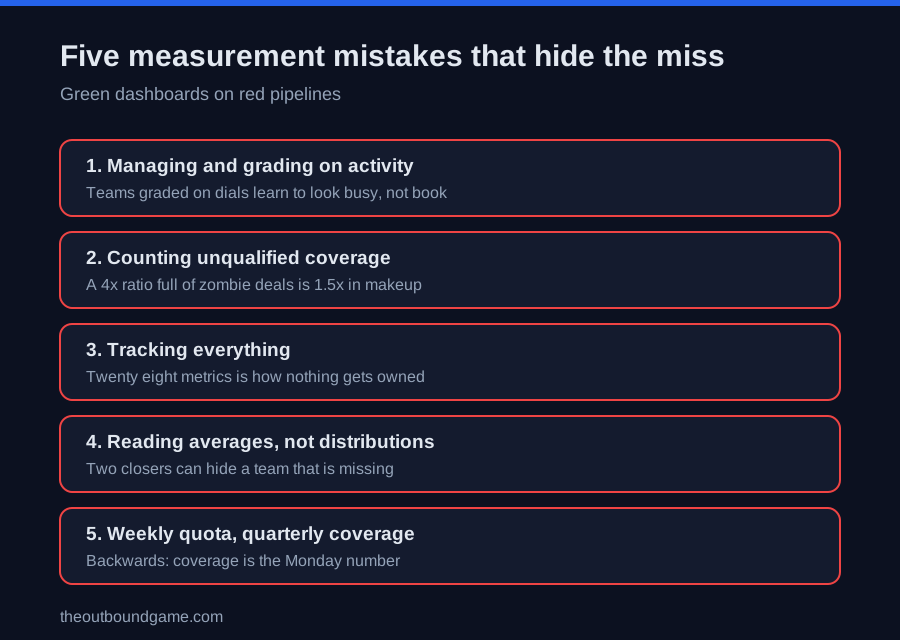
Five measurement mistakes that hide the miss
-
Managing on activity, evaluating on activity. Dials and sends are coaching inputs. Teams graded on them learn to look busy, and 47 percent of orgs still grade exactly this way.
-
Counting unqualified pipeline in coverage. A 4x ratio stuffed with stalled deals is 1.5x wearing makeup. Only opportunities past the qualification gate count.
-
Tracking everything. Twenty eight metrics is how nothing gets owned. Five to seven KPIs with owners and targets outperform the heatmap by 18 points of attainment.
-
Reading averages instead of distributions. Average attainment hides the 20 percent of reps carrying 80 percent of revenue. Distributions expose the real team.
-
Reviewing lagging metrics on a leading cadence. Quota is a quarterly truth; checking it weekly produces anxiety, not decisions. Coverage and velocity are the weekly numbers.
The eight step measurement system build
-
Pick 5 to 7 KPIs by the ownership test. Each with an owner, a target, and the decision it triggers. Everything else is context, not dashboard.
-
Run the bottom up quota math. Revenue target divided by average deal size, close rate, months, and reps yields required meetings, then required activities backward through your conversion rates, sanity checked against Apollo’s published KPI benchmarks rather than copied from them.
-
Define qualified once, in writing. The SQL gate, the meeting held standard, and the zombie rule: 14 silent days exits coverage.
-
Instrument by source and channel. Every meeting and opportunity tagged outbound, inbound, or partner, and by channel within outbound, so attribution is a query, not a debate.
-
Set the cadence. Activity daily for reps, conversion and coverage and velocity weekly for managers, win rate and cycle length monthly, full pipeline audit quarterly.
-
Wire the alerts. Coverage under 3x, show rate under 70, connect rate under the data quality floor, complaint rate at the deliverability thresholds from why cold emails go to spam.
-
Tie coaching to leading and pay to lagging, with ramp quotas stepped 25, 50, 75, 100 percent across the first four months so new reps are measured against ramp, not fantasy.
-
Audit the measurement itself quarterly. Forecast accuracy by rep is the test of whether the pipeline data is real, and per Gartner, the predictive layer most teams are now buying only amplifies whatever data quality it is fed, the same multiplier law from why sales automation fails.
How the measurement system fits the broader outbound stack
-
It grades the whole b2b outbound sales machine, layer by layer, source by source.
-
Its channel level detail lives in the cold email benchmarks hub, where the email tiers are kept honest.
-
Its most obsessed over single number gets its monograph in cold email reply rate, denominators and all.
-
Its calling funnel, conversations per day over dials, is argued in why cold calling still works.
-
Its founder stage starter panel ships inside how to start outbound sales, read directionally at small samples.
-
Its efficiency lever, the coordinated multichannel cadence, is built in sales cadence, where the activity to meeting ratio gets halved.
-
Its tooling layer, where the dashboards actually live, is compared in sales engagement platforms.
-
And its cautionary twin is why sales automation fails, where unmeasured time savings evaporate and unowned metrics rot.
FAQ
Frequently asked questions
How do you measure outbound sales performance?
What are the most important outbound sales KPIs?
What is a good pipeline coverage ratio?
How do you calculate pipeline velocity?
How many meetings should an SDR book per month?
What is the difference between leading and lagging indicators in sales?
What are vanity metrics in outbound sales?
The bottom line
How to measure outbound sales comes down to three layers, one rule, and a short list: activity for coaching, conversion for truth, pipeline for accountability, managed through the leading indicators and judged on the lagging ones, across 5 to 7 owned KPIs instead of a heatmap nobody reads. The formulas are simple, coverage over quota, velocity per day, touches per meeting, and the discipline is in the definitions: qualified means qualified, silent deals exit the math, and distributions beat averages every time. The teams that hit their numbers are not better closers. They are better measurers, and they see the miss in January while it can still become a made quarter.
Want more tested breakdowns like this? We publish one honest teardown of outbound tools, tactics, and playbooks each week. Join the newsletter.
More on Metrics & Ops
Cold Email Open Rates: What Is Good and What Is Real
Cold email open rates in 2026: the honest benchmarks, how Apple MPP inflates the number, the three uses that survive, and what to track instead.
Cold Email Benchmarks 2026: Every Number That Matters
Cold email benchmarks for 2026 in one place: reply rate, open rate, bounce rate, sequence length, meeting rates, and cost per meeting, tiered and sourced.
Cold Email Reply Rate: What Is Good and How to Raise It
Cold email reply rate in 2026: what counts as good, how to measure it honestly, and the seven levers that raise it, ranked by real effect size.